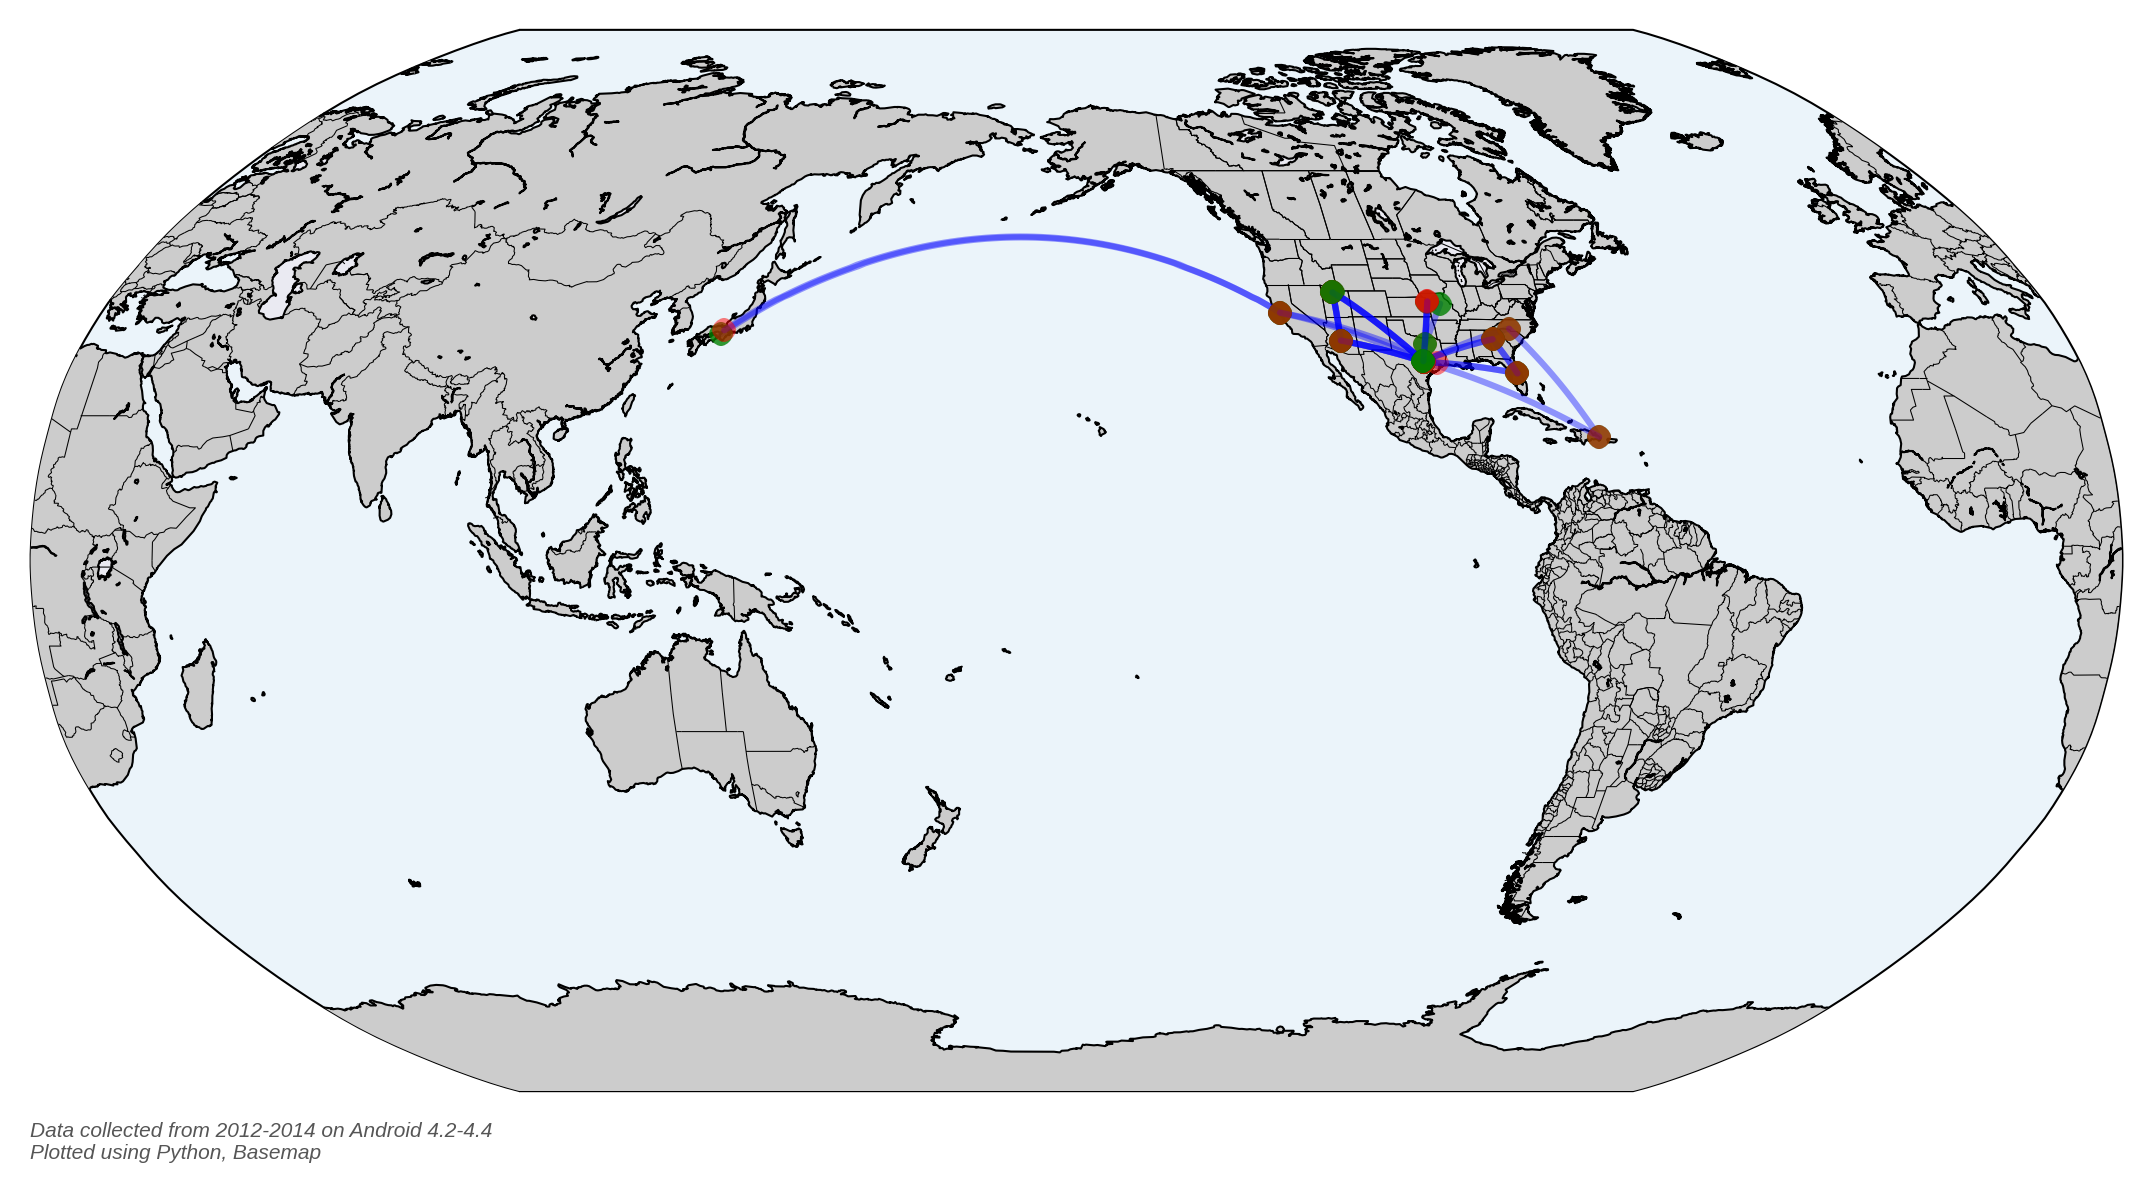
I made a map! I recently found a great tutorial on Beneath Data on how to visualize your location history from Google. I've been wanting to do something like this for a while, so I downloaded my location history for the past few years using Takeout, and made a quick plot of all the flights I've taken recently.
To do this, you'll need the following Python packages:
Far and above the easiest way to acquire these is to use the conda package manager provided by Continuum Analytics with the Anaconda Python Distribution. Once you've got Anaconda installed (which includes matplotlib, numpy and pandas), you can install (almost) all the necessary packages as follows:
conda install basemap shapely fiona
Unfortunately descartes isn't available in Continuum's official repositories, but it is available from the community repositories on binstar.org. Go there, search for 'descartes', and install it from the repository of your choice or just do the following:
On Linux:
conda install -c https://conda.binstar.org/auto descartes
On Mac OS X:
conda install -c https://conda.binstar.org/asmeurer descartes
With everything installed, it was easy to make a map showing all the flights I've taken in the past ~4 or so years by following this tutorial (scroll down to the second half). Awesome!

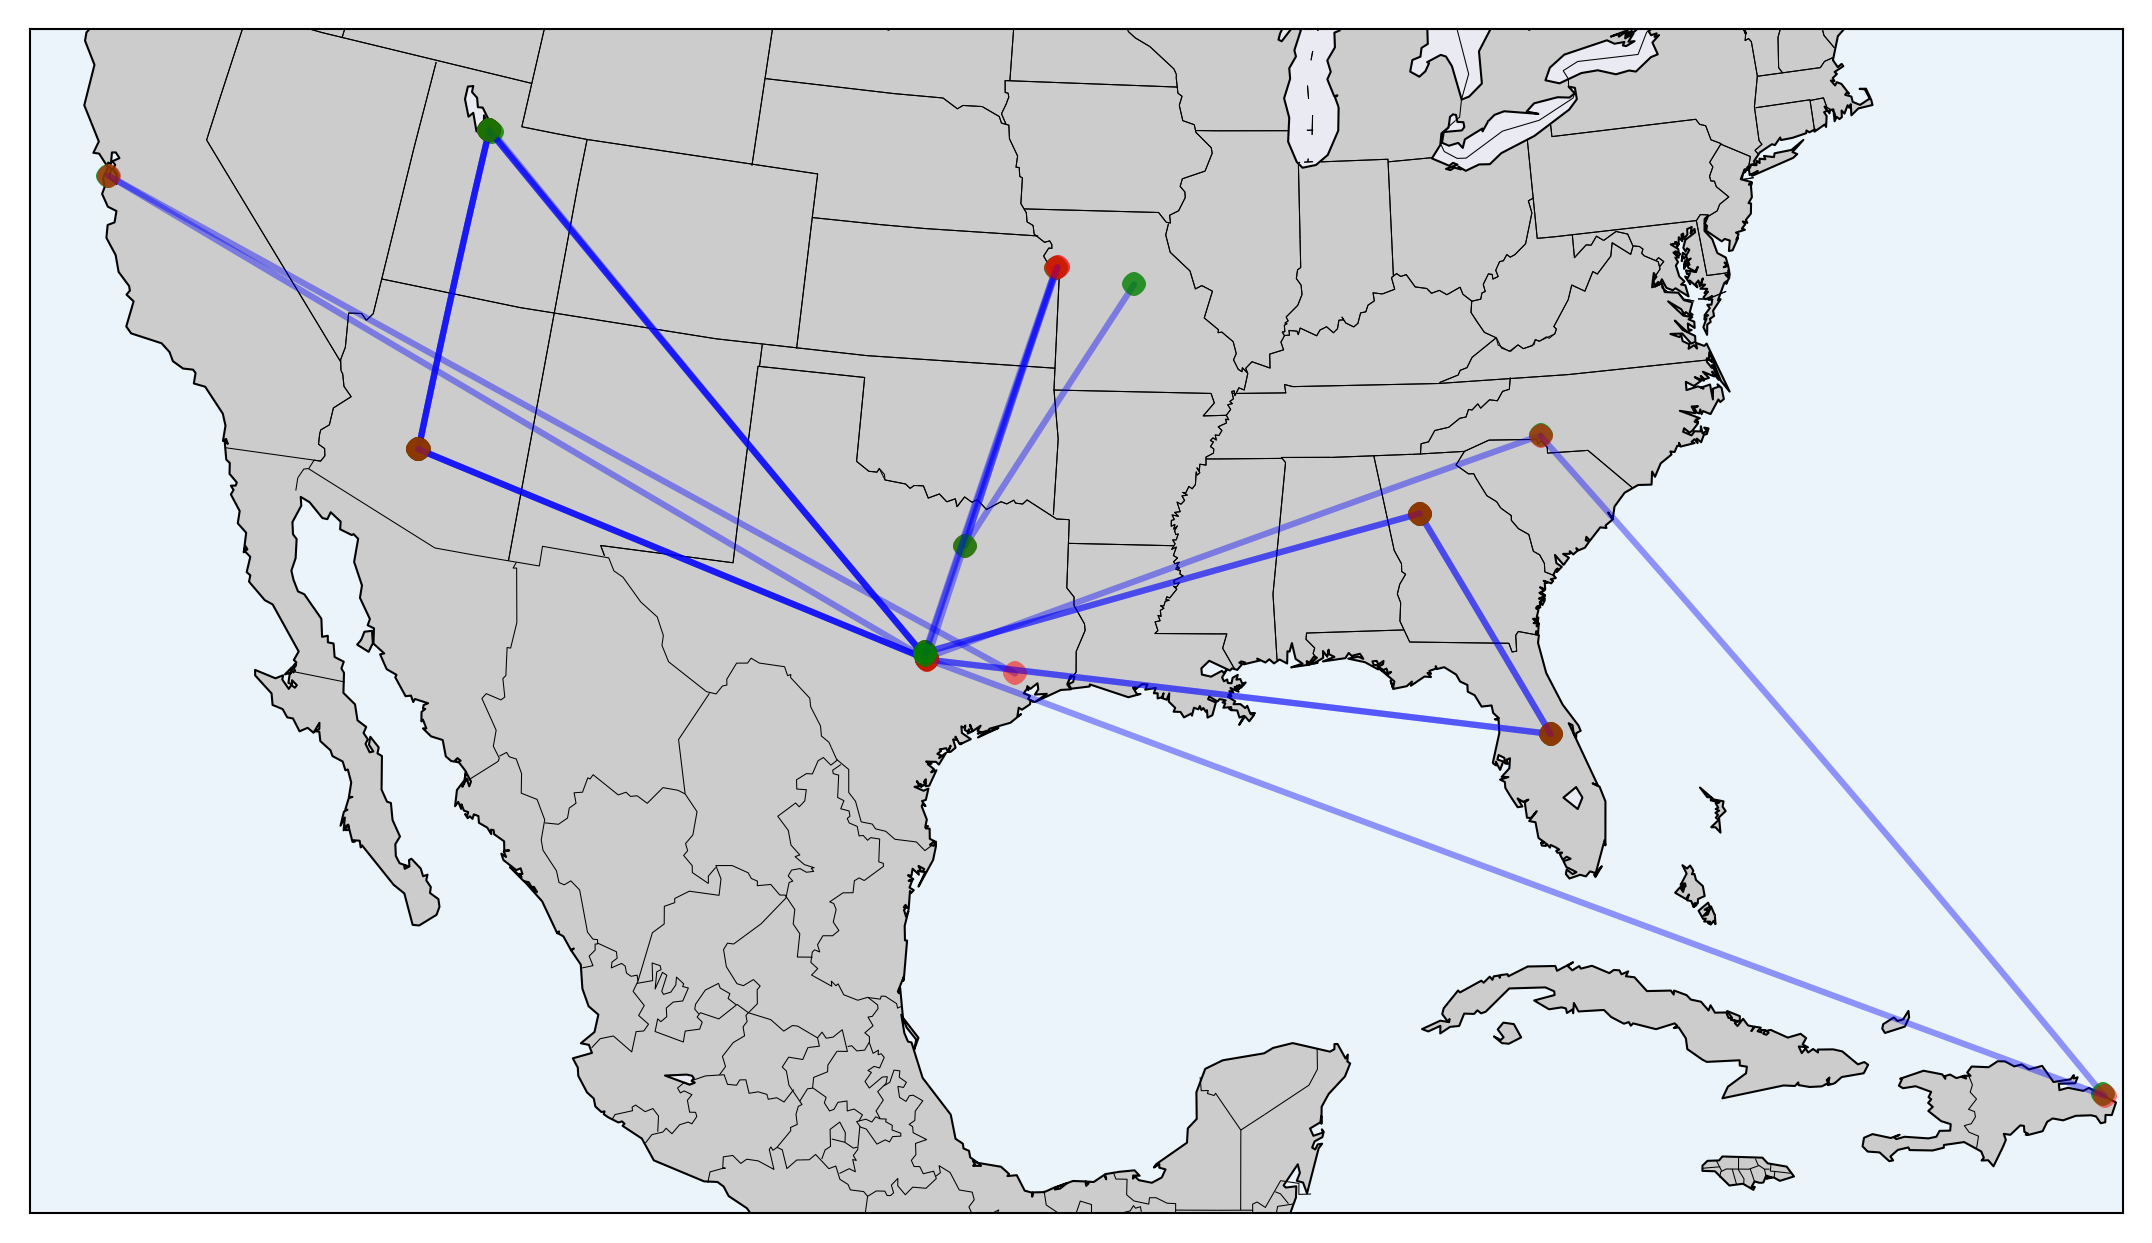
My trip to Japan for the First Stars IV conference dominates the first map; zooming in to just North America helps a bit:
